Details Visuals
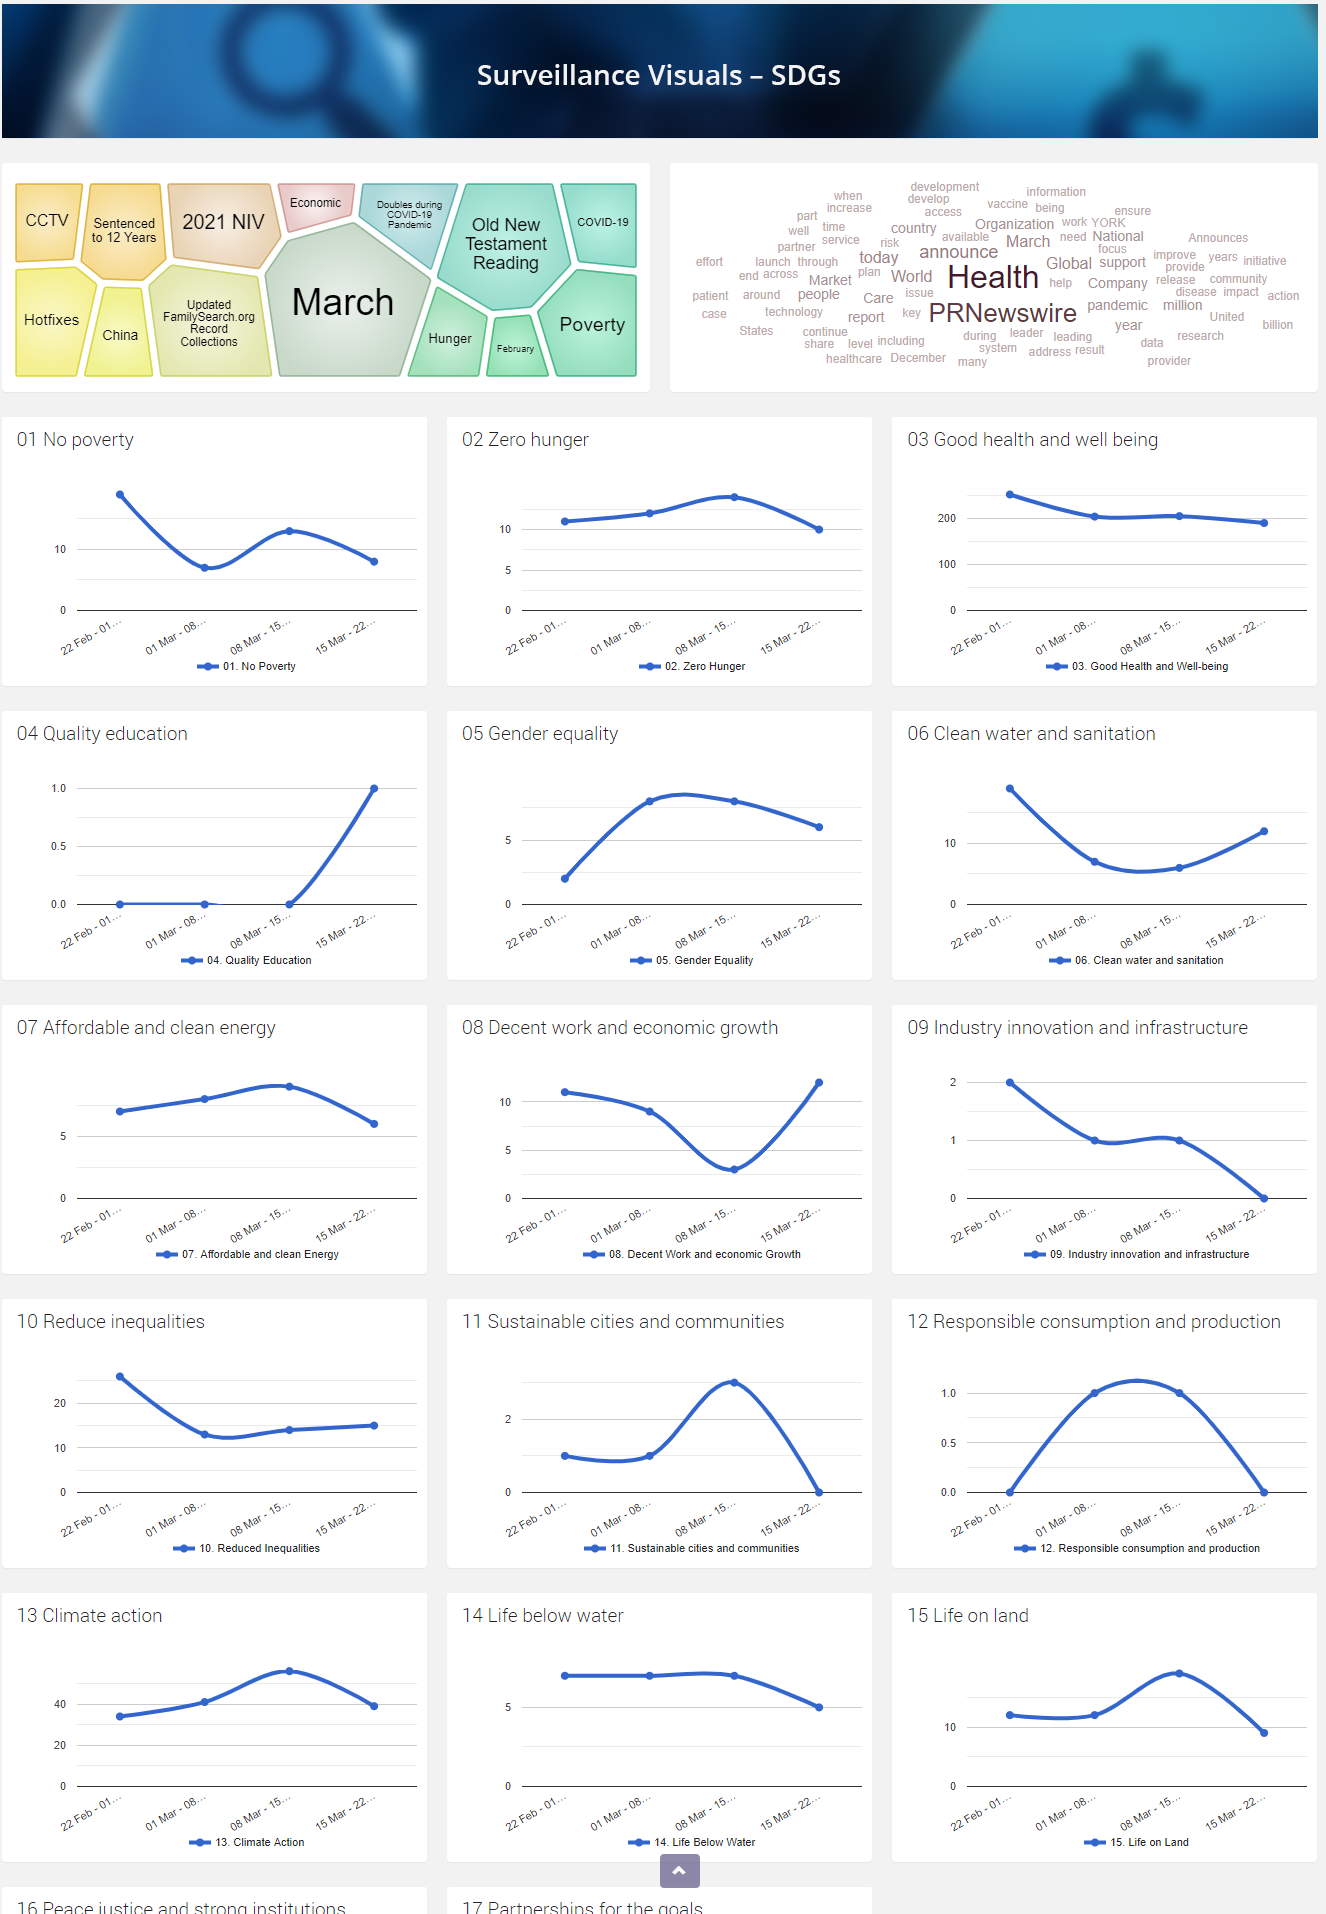
The Visuals dashboards has one specific purpose namely for the CSR managers/analysts to track SDG real time details of particular companies, products or industries.
With a set of trend and time graphs, representing the different Sustainable Development Goals (SDGs) the user can immediately spot any SDG details surfacing about a selected company, group of companies, product areas or other operation cross sections needed. This dashboard is a tool for company or segment sustainability analysis for the purpose of reporting as well as proactive CSR management actions.
The graphs are “clickable” meaning that any peak or dip in a particular factor curve can rapidly be explained as the content underlying such data point will then be displayed.
The SDG Visuals dashboard is the standard CSR Monitor set-up dashboard for this purpose. In addition, the customer can choose one or many add-ons from a range of similarly designed dashboards covering most of the major reporting and analysis frameworks available.

